Gyakkou Kyokushou System (Invite-only Overlay)This is an invite-only overlay indicator designed to help visually organize market context and reduce chart clutter. It does not execute trades. It provides visual guidance and optional alerts for decision support.
It overlays multiple visual modules such as trend ribbons (short/long moving-average ribbons), a moving-average bundle (GMMA-style visualization), Bollinger Bands for volatility reference, market session highlighting (Tokyo/London/New York with configurable time windows), and optional take-profit alerts based on a Heikin Ashi reference. Each module can be enabled/disabled, and colors/session times can be customized in settings.
This indicator is not financial advice. Signals/alerts are for reference only and do not guarantee results.
これは招待専用のオーバーレイ型インジケーターです。相場の状況を見やすく整理し、判断の補助として使います。自動売買は行いません。
短期帯/長期帯の移動平均の帯、移動平均線の束(GMMA風)、ボリンジャーバンド、市場時間(東京・ロンドン・NY)の背景ハイライト(時間は設定で変更可能)、平均足を参照した利確補助アラート等を、チャート上に重ねて表示します。各表示はオン/オフでき、色や時間などは設定から調整できます。
本インジケーターは投資助言ではありません。表示やアラートは参考情報であり、結果を保証しません。
Search in scripts for "session high"

VWAP Multi-Timeframe Pro═══════════════════════════════════════════════════════════════════════════════
VWAP Multi-Timeframe Pro - 6 VWAP + Dynamic Levels - Alphaomega18
📝 COMPLETE DESCRIPTION
═══════════════════════════════════════════════════════════════════════════════
🎯 THE MOST COMPLETE VWAP INDICATOR ON THE MARKETPLACE
VWAP Multi-Timeframe Pro simultaneously displays 6 different VWAPs (Asia/London/NY Sessions + Daily/Weekly/Monthly) with key price levels and intelligent dynamic color for complete institutional market vision.
Designed for professional traders: futures, forex, crypto, stocks. Compatible all timeframes.
🔥 WHY THIS INDICATOR IS UNIQUE
Other VWAP indicators display 1 or 2 VWAPs maximum.
**VWAP MTF Pro gives you EVERYTHING in one indicator:**
✅ **6 Simultaneous VWAPs**: Asia, London, NY, Daily, Weekly, Monthly
✅ **3 Key Price Levels**: Previous VWAP, Daily Open, Previous Close
✅ **Dynamic Color**: GREEN line if price above, RED if below
✅ **Standard Deviation Bands**: ±1σ, ±2σ, ±3σ for extreme deviations
✅ **10 Configurable Alerts**: Crossovers and extreme zones
✅ **100% Customizable**: Colors, styles, selective display
One indicator = Complete 24/7 institutional flow vision!
📊 THE 6 DISPLAYED VWAPS
🔷 **1. VWAP ASIA SESSION** (Yellow default)
→ Customizable Asian session (00:00-08:00 default)
→ Visible only during Asia session
→ Identifies key Asian trading levels
🔷 **2. VWAP LONDON SESSION** (Cyan default)
→ European session (08:00-16:00 default)
→ Visible only during London session
→ Captures European institutional flow
🔷 **3. VWAP NY SESSION** (Orange default)
→ American session (15:30-22:00 default)
→ Visible only during NY session
→ Highest volume of the day
🔷 **4. VWAP DAILY** (Blue default)
→ Full day VWAP
→ Most important level for day traders
→ Major support/resistance
🔷 **5. VWAP WEEKLY** (Purple default)
→ Weekly VWAP
→ Medium-term trend
→ Key level for swing traders
🔷 **6. VWAP MONTHLY** (Fuchsia default)
→ Monthly VWAP
→ Long-term vision
→ Major institutional levels
📍 3 ESSENTIAL PRICE LEVELS (NEW)
🔷 **PREVIOUS DAY VWAP CLOSE** (Dashed line - Dynamic color!)
**The Revolutionary Feature:**
→ Displays previous day's VWAP Daily close
→ **GREEN line** when price ABOVE = Bullish signal ✅
→ **RED line** when price BELOW = Bearish signal ❌
→ Changes color in real-time at crossover!
**Why it's powerful:**
```
If you're trading LONG and line is GREEN:
→ You're on right side of market
→ Institutions are with you
→ Hold trade with confidence
If line turns RED:
→ EXIT immediately
→ Momentum has changed
→ Institutions selling now
```
🔷 **DAILY OPEN** (White dotted default)
→ Current day's opening price
→ Major psychological level
→ Intraday support/resistance
🔷 **PREVIOUS DAY CLOSE** (Purple dotted default)
→ Previous day's close
→ Gap analysis (up/down/none)
→ Critical institutional level
📏 STANDARD DEVIATION BANDS
**3 Bands on each side of VWAP:**
→ ±1σ (68% of distribution)
→ ±2σ (95% of distribution)
→ ±3σ (99.7% of distribution)
**VWAP selection for bands:**
Choose from: Asia / London / NY / Daily / Weekly / Monthly
**Usage:**
```
Price reaches +3σ:
→ Extreme overbought
→ Reversal or consolidation likely
→ Take LONG profits or prepare SHORT
Price reaches -3σ:
→ Extreme oversold
→ Reversal or consolidation likely
→ Take SHORT profits or prepare LONG
Price between ±1σ:
→ "Normal" zone
→ Trading range
→ Wait for breakout
```
🎯 REAL USE CASES
📌 **CASE 1: MNQ Day Trading with Dynamic Color**
**Morning Setup:**
```
08:00 - Market opens
→ Price at 16,300
→ Prev Day VWAP Close at 16,250
→ Line = GREEN ✅ (price above)
→ Signal: Bullish sentiment confirmed
Action: Look for LONG setups only
Avoid: SHORT trades against trend
```
**Momentum Change:**
```
10:30 - Price drops rapidly
→ Price drops to 16,240
→ Line turns RED ❗
→ Signal: Momentum changed!
Action: EXIT LONG positions immediately
Look for: SHORT setups now
```
**Result:**
→ You stay on right side of market permanently
→ No fighting institutions
→ Profits maximized, losses minimized
📌 **CASE 2: Gap Analysis with Daily Open + Prev Close**
**Gap UP:**
```
Daily Open (white): 16,320
Prev Day Close (purple): 16,280
Gap = +40 points
Analysis:
→ Bullish gap
→ If VWAP prev line = GREEN = Continuation
→ If price retests Prev Close (purple) and bounces = LONG entry
```
**Gap DOWN:**
```
Daily Open (white): 16,240
Prev Day Close (purple): 16,280
Gap = -40 points
Analysis:
→ Bearish gap
→ If VWAP prev line = RED = Continuation
→ If price rallies to Prev Close (purple) and rejects = SHORT entry
```
📌 **CASE 3: Multi-Timeframe Confirmation**
**LONG Setup Maximum Conviction:**
```
✅ Price > VWAP Monthly (fuchsia) → Long-term bullish trend
✅ Price > VWAP Weekly (purple) → Medium-term bullish trend
✅ Price > VWAP Daily (blue) → Short-term bullish trend
✅ Prev Day VWAP = GREEN → Today's momentum bullish
✅ Price > Daily Open (white) → Positive opening
Signal: ALL timeframes aligned LONG!
Action: LONG entry with strong conviction
Stop: Below VWAP Daily
```
**SHORT Setup Maximum Conviction:**
```
✅ Price < VWAP Monthly (fuchsia) → Long-term bearish trend
✅ Price < VWAP Weekly (purple) → Medium-term bearish trend
✅ Price < VWAP Daily (blue) → Short-term bearish trend
✅ Prev Day VWAP = RED → Today's momentum bearish
✅ Price < Daily Open (white) → Negative opening
Signal: ALL timeframes aligned SHORT!
Action: SHORT entry with strong conviction
Stop: Above VWAP Daily
```
📌 **CASE 4: Session Trading (London/NY Overlap)**
**15:30 - NY Session Opens:**
```
Before 15:30:
→ Price in VWAP London (cyan)
→ Consolidation, range
15:30 - NY opens:
→ VWAP NY (orange) appears
→ Volume explodes
→ Price breaks above VWAP Daily (blue)
→ Prev Day VWAP = GREEN ✅
Action:
→ LONG entry on breakout
→ Stop below VWAP Daily
→ Target +3σ upper band
```
⚙️ COMPLETE CUSTOMIZATION
🎨 **EACH VWAP IS CONFIGURABLE:**
**For each VWAP (6 groups):**
→ Show/Hide (On/Off)
→ Customizable color
→ Line thickness (1-5)
**Asia/London/NY Sessions:**
→ Configurable start/end hours
→ Adapt to your timezone
→ Customize per market
**Forex Example:**
```
Asia: 00:00-08:00 (Tokyo)
London: 08:00-16:00 (London)
NY: 13:00-20:00 (New York)
```
**US Futures Example:**
```
Asia: 18:00-02:00 (overnight)
London: 02:00-08:30
NY: 08:30-15:00 (RTH)
```
🎨 **PREVIOUS DAY VWAP - Dynamic Color:**
→ **Dynamic Color (Green/Red)**: On/Off
• ON = Line changes color (GREEN/RED)
• OFF = Fixed color
→ **Color Above**: Color when price above (default: Green)
→ **Color Below**: Color when price below (default: Red)
→ **Static Color**: If Dynamic Color OFF (default: White)
→ **Line Width**: Thickness (1-5)
→ **Line Style**: Solid / Dashed / Dotted
🎨 **DAILY PRICE LEVELS:**
**Daily Open:**
→ Show/Hide
→ Color (default: White)
→ Thickness
→ Style (Solid/Dashed/Dotted)
**Previous Day Close:**
→ Show/Hide
→ Color (default: Purple/Fuchsia)
→ Thickness
→ Style (Solid/Dashed/Dotted)
📏 **STANDARD DEVIATION BANDS:**
→ **Show Bands**: On/Off
→ **Bands Timeframe**: Choose VWAP (Asia/London/NY/Daily/Weekly/Monthly)
→ **Standard Deviation 1/2/3**: σ values (default: 1.0 / 2.0 / 3.0)
→ **Upper Colors**: Customizable
→ **Lower Colors**: Customizable
👁️ **DISPLAY:**
→ **Show Labels**: Display price labels (On/Off)
→ **Label Size**: Tiny / Small / Normal / Large
🔔 COMPLETE ALERTS (10 ALERTS)
**VWAP Daily Crossovers:**
1. Price > VWAP Daily
2. Price < VWAP Daily
**Extreme Bands:**
3. Price reaches +3σ
4. Price reaches -3σ
**Previous Day VWAP:**
5. Price > Previous Day VWAP
6. Price < Previous Day VWAP
**Daily Open:**
7. Price > Daily Open
8. Price < Daily Open
**Previous Day Close:**
9. Price > Previous Close
10. Price < Previous Close
💡 MARKETS AND TIMEFRAMES
✅ **ALL markets compatible:**
• Futures (ES, NQ, YM, RTY, MNQ, MES, etc.)
• Forex (EUR/USD, GBP/USD, USD/JPY, etc.)
• Crypto (BTC, ETH, altcoins - 24/7)
• Stocks (Tesla, Apple, Nvidia, etc.)
• Indices (S&P 500, Nasdaq, Dow Jones)
• Commodities (Gold, Oil, etc.)
✅ **All timeframes:**
• Scalping: 1min, 5min
• Day Trading: 15min, 30min, 1H ⭐ (optimal!)
• Swing Trading: 4H, Daily
• Position Trading: Weekly
Note: More reliable with real volume data
→ TradingView Premium recommended for tick data
🏆 UNIQUE ADVANTAGES
✅ **6 Simultaneous VWAPs**: Complete multi-timeframe vision
✅ **Dynamic color**: GREEN/RED for instant vision
✅ **3 Price levels**: Prev VWAP + Open + Prev Close
✅ **Standard deviation bands**: ±3σ for extreme zones
✅ **Customizable sessions**: Asia/London/NY adaptable
✅ **10 alerts**: All key crossovers
✅ **100% customizable**: Colors, styles, display
✅ **Automatic labels**: Real-time price display
✅ **Optimized code**: Light, fast, no lag
✅ **No repaint**: Reliable and stable signals
📊 RECOMMENDED CONFIGURATION
**For MNQ/ES Day Trading (15min):**
```
═══ VWAP Sessions ═══
Asia: ✅ ON (Yellow)
London: ✅ ON (Cyan)
NY: ✅ ON (Orange)
═══ VWAP Timeframes ═══
Daily: ✅ ON (Blue)
Weekly: ✅ ON (Purple)
Monthly: ❌ OFF (too long-term)
═══ Previous Day VWAP ═══
Show: ✅ ON
Dynamic Color: ✅ ON (CRITICAL!)
Color Above: Green
Color Below: Red
Width: 2-3
═══ Daily Price Levels ═══
Daily Open: ✅ ON (White dotted)
Prev Day Close: ✅ ON (Purple dotted)
═══ Bands ═══
Show Bands: ✅ ON
Timeframe: Daily
σ: 1.0 / 2.0 / 3.0
═══ Display ═══
Labels: ✅ ON
Size: Small
```
**For Scalping (1-5min):**
```
Sessions: Asia/London/NY by hour
Daily/Weekly: ON
Monthly: OFF
Prev Day VWAP: ON with Dynamic Color
Bands: Daily, ±2σ max
Labels: Small or Tiny
```
**For Swing Trading (4H-Daily):**
```
Sessions: OFF (not relevant)
Daily: ON
Weekly: ON
Monthly: ON
Prev Day VWAP: ON
Bands: Weekly, ±3σ
Labels: Normal or Large
```
🎓 QUICK USAGE GUIDE
**Simple Rules for Day Traders:**
1. **Prev VWAP Line Color = Day Direction**
→ GREEN = Trade LONG only
→ RED = Trade SHORT only
2. **Price above ALL VWAPs = Maximum bullish**
→ Look for LONG setups only
→ No SHORT counter-trend
3. **Price below ALL VWAPs = Maximum bearish**
→ Look for SHORT setups only
→ No LONG counter-trend
4. **Price between VWAPs = Neutral zone**
→ Wait for clear breakout
→ Range-bound, careful scalp
5. **±3σ bands = Extreme zones**
→ Take profits
→ Or wait for reversal
💪 TRADER PSYCHOLOGY
**What this indicator solves:**
❌ "I don't know if trend continues"
→ Check prev VWAP line color: GREEN = continues
❌ "I take profits too early from fear"
→ As long as line GREEN, hold LONG with confidence
❌ "I hold my losses too long"
→ Line turns RED? EXIT immediately!
❌ "I trade counter-trend"
→ 6 VWAPs visible = Impossible to mistake direction
❌ "I don't know where to put stop"
→ Stop below VWAP Daily for LONG, above for SHORT
**Result:**
✅ Increased confidence
✅ Reinforced discipline
✅ Maximized profits
✅ Trading with institutions
🔗 PERFECT COMPLEMENT
**Combine VWAP MTF Pro with:**
• **Order Flow Signals** → Institutional absorptions (💎▲🚀)
• **Order Flow CVD** → Real-time order flow
• **Fair Value Gaps** → Inefficiency zones
• **Market Profile** → POC/VPOC
**VWAP MTF Pro** = Institutional price levels
**Order Flow** = Flow confirmation
→ Complete trading system!
⚠️ DISCLAIMER
Technical indicators are decision support tools. No indicator guarantees profits. Always use:
• Appropriate risk management
• Stop loss on every trade
• Proper position sizing
• Demo account testing first
VWAP MTF Pro improves your analysis but doesn't replace a complete strategy with money management.
🚀 INSTALLATION
1. Copy the Pine Script code
2. Open Pine Editor in TradingView
3. Paste the code
4. Click "Add to Chart"
5. Indicator displays on chart (overlay)
6. Configure parameters to your preferences
7. Activate desired alerts
8. Trade with complete institutional vision!
💡 PRO TIP
**The Golden VWAP Rule:**
"NEVER trade against ALL aligned VWAPs"
If Monthly + Weekly + Daily ALL point down:
→ Bearish market on ALL timeframes
→ Trade SHORT only
→ No LONG = Suicide
If Monthly + Weekly + Daily ALL point up:
→ Bullish market on ALL timeframes
→ Trade LONG only
→ No SHORT = Lost money
This simple rule can **save your account**!
📞 CONTACT AND SUPPORT
Created by Alphaomega18
For questions, bugs or suggestions:
Find my other indicators:
• Order Flow Signals (institutional signals)
• Order Flow Dashboard (CVD oscillator)
• Order Flow CVD Simple (trend vision)
• Fair Value Gap Detector
• Volume & Volatility Crisis Detector

GHOST Premium IndicatorGHOST Premium Indicator – Session ORB + True Day Open Levels
GHOST Premium is a full session-mapping tool built for futures traders who live off levels, not guesses. It automatically plots:
15-Minute ORB Zones for
Asia (19:00 NY)
London (03:00 NY)
New York (09:30 NY)
Each ORB is drawn as a dynamic box that tracks the high/low during the window, then locks in and projects high, low, and midline rays forward into the session so you can trade clean reaction levels.
Asia Session High/Low (19:00–00:00 NY)
Choose between Rays, Boxes, or Both.
Session high/low rays extend right across the chart.
Optional “extreme candle” boxes from a user-selected timeframe (1–15m) give you a visual anchor for key impulsive moves.
Labels for Asia High/Low stay pinned to the right edge of the chart using a configurable offset.
London Session High/Low (03:00–08:00 NY)
Same logic as Asia: live-updating session high/low, projected as rays or boxes.
Session objects persist until 16:50 NY, then auto-clean so your chart never gets cluttered.
Labels for London High/Low and their boxes also slide with price to the right side of the chart.
True Day Open (TDO)
Calculates calendar day open at 00:00 ET, even though the futures session starts at 18:00.
Draws a horizontal ray from TDO across the entire day.
Drops a “TDO” label on the level and keeps it pinned to the right edge with its own adjustable offset.
Fully customizable ray color, label color, and line width.
All key visuals are user-configurable: session toggles, colors, transparency, line widths, midline style, label offsets, and extreme-candle timeframes.
Use GHOST Premium to instantly see where Asia, London, NY, and the True Day Open are controlling order flow – so you can build your bias and executions around the same levels smart money respects.

SMC + OB + FVG + Reversal + UT Bot + Hull Suite – by Fatich.id🎯 7 INTEGRATED SYSTEMS:
✓ Mxwll Suite (SMC + Auto Fibs + CHoCH/BOS)
✓ UT Bot (Trend Signals + Label Management)
✓ Hull Suite (Momentum Analysis)
✓ LuxAlgo FVG (Fair Value Gaps)
✓ LuxAlgo Order Blocks (Volume Pivots) ⭐ NEW
✓ Three Bar Reversal (Pattern Recognition)
✓ Reversal Signals (Momentum Count Style)
⚡ KEY FEATURES:
• Smart Money Structure (CHoCH/BOS/I-CHoCH/I-BoS)
• Auto Fibonacci (10 customizable levels)
• Order Block Detection (Auto mitigation)
• Fair Value Gap Tracking
• Session Highlights (NY/London/Asia)
• Volume Activity Dashboard
• Multi-Timeframe Support
• Clean Label Management
🎨 PERFECT FOR:
• Smart Money Concept Traders
• Order Flow & Liquidity Analysis
• Support/Resistance Trading
• Trend Following & Reversals
• Multi-Timeframe Analysis
💡 RECOMMENDED SETTINGS:
Clean Charts: OB Count 3, UT Signals 3, FVG 5
Detailed Analysis: OB Count 5-10, All Signals
Scalping: Low sensitivity, Hull 20-30
Swing Trading: High sensitivity, Hull 55-100

Aurora Reversal Suite: Liquidity & Inversion ModelConcept & Methodology The Aurora Reversal Suite is not a general-purpose indicator; it is a hard-coded algorithmic implementation of a specific institutional reversal model often referred to as the "2022 Mentorship Model" or "Sweep-to-Inversion" setup.
While many scripts display Liquidity Sweeps or Fair Value Gaps individually, this script solves the problem of "confluence fatigue" by algorithmically enforcing a strict order of operations. It does not alert on every sweep; it alerts only when a specific sequence of price action events occurs in a verified order.
The Algorithmic Logic (How it Works) The core value of this script lies in its conditional filtering logic, which automates the following manual verification process:
Event A: Liquidity Sweep
The script first monitors key institutional levels: Previous Day High/Low, Session High/Low (Asia/London/NY), and dynamic Swing Points.
It detects a "Sweep" event when price breaches a level but fails to close beyond it (or closes back inside within a defined lookback period).
Event B: Displacement & Inversion
Unlike standard FVG indicators, this script searches specifically for Inversion FVGs (iFVG) that form immediately following the sweep event.
The script logic requires that the iFVG be created by the displacement leg that reverses the sweep. This binds the "Entry Signal" directly to the "Liquidity Event."
Event C: Algorithmic Filtering (The "Strict" Mode)
To filter out false positives common in choppy markets, the script applies a multi-layer filter before printing a signal:
Volume Qualification: The signal bar's volume must exceed a user-defined multiple of the N-period average volume (default 1.5x) to confirm institutional participation.
SMT Divergence Filter: The script cross-references a correlated asset (e.g., NQ vs. ES or EU vs. DXY). If enabled, a signal is only valid if the correlated asset failed to make a matching high/low at the moment of the sweep (SMT Divergence).
Bias Alignment: The script calculates directional bias using a waterfall logic (Daily > 4H > 1H). Signals counter to this calculated bias are suppressed in "Strict" mode.
Included Features & Components
Automated Market Structure: Real-time labeling of BOS (Break of Structure) and MSS (Market Structure Shift) based on swing point logic.
Session Killzones: Visual boxes for Asia, London, and NY sessions with auto-extending high/low lines to track session liquidity.
Multi-Timeframe Dashboard: A calculated table displaying the trend state of the Daily, 4H, and 1H timeframes to assist with top-down analysis.
Power of 3 (PO3) Overlay: Visualization of higher-timeframe candle geometry on lower-timeframe charts to identify accumulation/distribution phases.
Why This Mashup is Necessary Attempting to trade this specific reversal model using separate indicators results in chart clutter and conflicting signals. By combining the Sweep detection, iFVG creation, and SMT filtering into a single codebase, we can programmatically eliminate "naked" sweeps that have no displacement, providing a cleaner and more objective view of the market structure.
Settings & Customization
Signal Mode: Choose between "Simple" (Price Action only) or "Strict" (Trend + Volume filtered).
SMT Input: Manually define the correlated asset ticker for divergence checks.
Visuals: Fully customizable colors for Bullish/Bearish scenarios to fit light or dark themes.
Disclaimer This script is a tool for market analysis and does not guarantee future results. It is intended to assist traders in identifying high-probability setups based on historical price action concepts.

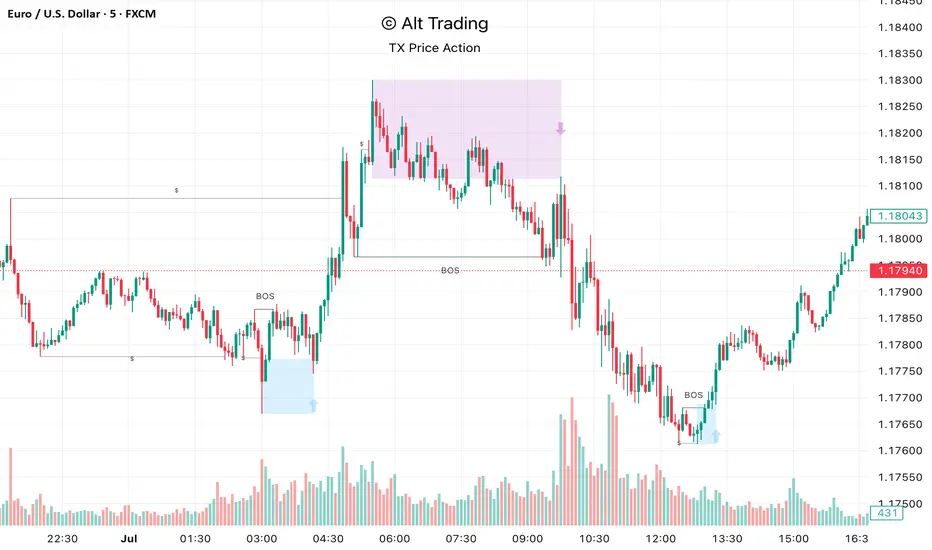
Alt Trading: TX Price Action
The Alt Trading: TX Price Action Indicator is a multi-layered market-structure and liquidity engine built for intraday and swing traders who want a clean, rules-based map of how price is actually moving through liquidity. It runs a fractal-based swing engine in the background to define objective structure, then derives Break-of-Structure (BOS) legs, inducement sweeps, and execution zones from that single model so nothing on the chart is contradictory or “bolted on.” Asian-session profiling builds a dynamic liquidity range that anchors the QuickStrikes filter, allowing you to require BOS and/or entry zones to sit in specific relation to session highs/lows before a setup is even allowed to print. Displacement legs are converted into Fibonacci- and POI-based retracement zones with configurable frequency (High/Medium/Low), automatically projecting forward in time with transparent, non-intrusive boxes for both long and short scenarios. A tiered inducement engine tracks minor (current day), medium (previous day), and major (weekly) highs and lows, promoting levels to permanent lines once they’ve been meaningfully swept, and labeling them directly on the chart for instant context. As sweeps form and BOS confirms, the indicator constructs entry zones, optional risk/reward panels, and live-updating TP/SL visualization boxes that track active long or short scenarios until completion. All elements—zones, BOS lines, inducement levels, fractal structure, arrows, and risk blocks—are fully style-able so the tool can be tuned to any chart theme without losing clarity. TX Price Action doesn’t attempt to “predict” price; instead, it translates complex liquidity behavior into a consistent, visual playbook that makes it easier to systematize premium/discount entries and manage trades with discipline.
JP7FX Signals ProJP7FX Signals Pro
Smart session signals based on structure, liquidity shifts and volatility filters.
Designed for use on the 1 minute timeframe.
What this tool does
This indicator builds signals around three things traders track every day.
• session ranges for Asia, Frankfurt, London and New York
• Fair Value Gap behaviour
• Supertrend shifts with volatility confirmation
The script draws each session range on your chart. It tracks when price breaks a session high or low, then checks if the market is above or below the daily open. These conditions help filter trades by direction during different sessions.
It also detects bullish and bearish Fair Value Gaps. The script tracks when an FVG forms, when price enters the imbalance and when it gets mitigated. These checks create part of the signal logic.
Supertrend is used as an extra filter. A crossover above or below the Supertrend gives a directional bias. When combined with session behaviour and FVG conditions, the script can mark possible long or short signals during London or New York.
How the signals form
A signal only prints when the script has all conditions in place.
This includes:
• a session range break in the correct direction
• a price position relative to the daily open
• confirmation from Supertrend
• FVG creation or mitigation on the right side of price
• liquidity taken in previous sessions
These rules reduce noise and avoid signals that appear in weak conditions.
What the indicator is for
• understanding how sessions behave on the 1 minute chart
• tracking liquidity behaviour
• seeing when a clean break and trend shift takes place
• getting notified when the market forms the conditions you set
This is not a buy or sell system on its own
Signals do not replace analysis. You still need market structure, higher timeframe direction, orderblocks or your own trade model.
A signal is only a prompt to look at the chart, not a confirmation to enter a trade.
Price can shift quickly around sessions, so check the context before acting on any alert.
Important notes
• designed for the 1 minute timeframe
• signals do not guarantee trend continuation
• conditions can form in strong or weak market phases
• use your own risk rules and validation before entering trades
JP7FX Signals Pro helps you track session behaviour and FVG interaction more efficiently, but trading decisions still need your full chart process.

1M XAU Cumulative Delta Volume with OB Breakouts
### Overview
This is a **session-based CVD strategy** built around the **00:00–07:00 CEST range**. It finds the high/low of that session, turns them into **adaptive ATR-based support (yellow)** and **resistance (purple)** zones, and trades only **CVD-confirmed reversals** off those levels.
---
### How it Works
* For each day, the script:
* Builds a 00:00–07:00 CEST **profile high/low**.
* Creates a **support zone** around the session low and a **resistance zone** around the session high.
* Using lower timeframe data, it reconstructs **Cumulative Volume Delta (CVD)** and a **recent delta** filter.
* It arms “pending” states when price **enters a zone from the correct side**, then confirms:
* **BUY (long):** price reclaims above support and recent CVD is strongly positive.
* **SELL (short):** price rejects below resistance and recent CVD is strongly negative.
Only these two CVD signals (`buySignal` / `sellSignal`) open trades.
---
### Strategy Logic
* **Entries**
* `buySignal` → open **long** (if flat).
* `sellSignal` → open **short** (if flat).
* No pyramiding; one position at a time.
* **Exits (only TP & SL)**
* Long: TP at `avg_price * (0.5 + TP%)`, SL at `avg_price * (1 – SL%)`.
* Short: TP at `avg_price * (0.5 – TP%)`, SL at `avg_price * (1 + SL%)`.
* No opposite-signal exits.
---
### Extras
* **Reversal markers** on yellow/purple zones and **breakout/retest markers** are plotted for context and alerts but **do not trigger entries**.
* Zone width and “thickening” are ATR-based so important touches and near-touches are easy to see.
* Only suited for **1m intraday scalping** (e.g. XAU/USD), but can be tested on other markets/timeframes.

Sessions Indicator(clean))🔰 True Day Open + Asian / London / NY Session Levels
Intraday Market Structure & Session Liquidity Indicator
This indicator automatically plots the True Day Opening Price, Asian Session High & Low, London Session High & Low, and New York Session Open — helping you understand daily directional bias, session liquidity zones, and potential reversal levels.
📌 What It Does
✔ Plots True Day Open (not broker-based — captures real market direction)
✔ Marks Asia Session High & Low – accumulation zone
✔ Marks London Session High & Low – expansion zone
✔ Shows New York Session Open – reversal / continuation zone
✔ Works on any chart: Forex, Indices, Crypto, Commodities
✔ Ideal for ICT / SMC / Day Trading / Scalping
✔ Fully customizable colors & display options
🧠 Why It’s Useful
The market often moves in this sequence:
➡ Asia → consolidation
➡ London → expansion / breakout
➡ New York → reversal OR continuation
This indicator helps you see this structure clearly, allowing traders to:
Avoid fake breakouts
Understand the daily bias earlier
Trade liquidity grabs & session-to-session transitions
Time entries with precision
📌 Best Timeframes
M5 / M15 / M30 → Scalping & intraday setups
H1 / H4 → Market structure view
Daily → Session zone backtesting
⚙ Inputs & Customization
Enable/Disable each session
Change session time manually
Color settings
Line styles: solid / dashed / background zones
🧠 Suggested Trading Concepts
Works great with:
Smart Money Concepts (SMC)
ICT Models
Liquidity Sweep Strategy
Session Breakout Trading
Mean Reversion Trading
📈 How to Use
Wait for Asian Range
Trade break of Asian High/Low during London
At NY Open, check for reversal or continuation
Use True Day Open for directional bias
Look for liquidity sweeps near session levels
📢 Coming Soon (Next Update)
🔔 Session Break Alerts
📊 Liquidity Sweep Labels

Gabbie - LiquidityGabbie – Liquidity identifies high-probability liquidity pools on your current trading timeframe. It detects swing highs/lows that fail to meaningfully break prior highs/lows, marking areas where liquidity is most likely resting.
It also plots:
Asia Session High / Low as a key liquidity and mean-reversion zone
Support & Resistance zones derived from recent swing behavior on the active timeframe
This indicator is designed to support discretionary traders who model liquidity, sessions, and structure.
Settings
Adjust the font size of the liquidity labels ($$$).
All other features are optimized to work on default settings.
Limitations / reminder
Liquidity levels are probabilistic. Use alongside confirmation tools and always apply your own risk management.

Session Range Boxes (Budapest time) GR V2.0Session Range Boxes (Budapest time)
This indicator draws intraday range boxes for the main Forex sessions based on Europe/Budapest time (CET/CEST).
Tracked sessions (Budapest time):
Asia: 01:00 – 08:00
Frankfurt (pre-London): 08:00 – 09:00
London: 09:00 – 18:00
New York: 14:30 – 23:00
For each session, the script:
Detects the session start and session end using the current chart timeframe and the Europe/Budapest time zone.
Tracks the high and low of price during the entire session.
Draws a box (rectangle) from session open to session close, covering the full price range between session high and low.
Optionally prints a small label above the first bar of each session (Asia, Fra, London, NY).
Color scheme:
Asia: soft orange box
Frankfurt: light aqua box
London: darker blue box
New York: light lime box
Use this tool to:
Quickly see which session created the high/low of the day,
Identify liquidity zones and session ranges that price may revisit,
Visually separate Asia, Frankfurt, London and New York volatility on intraday charts.
Optimized for intraday trading (Forex / indices), but it works on any symbol where session behavior matters.

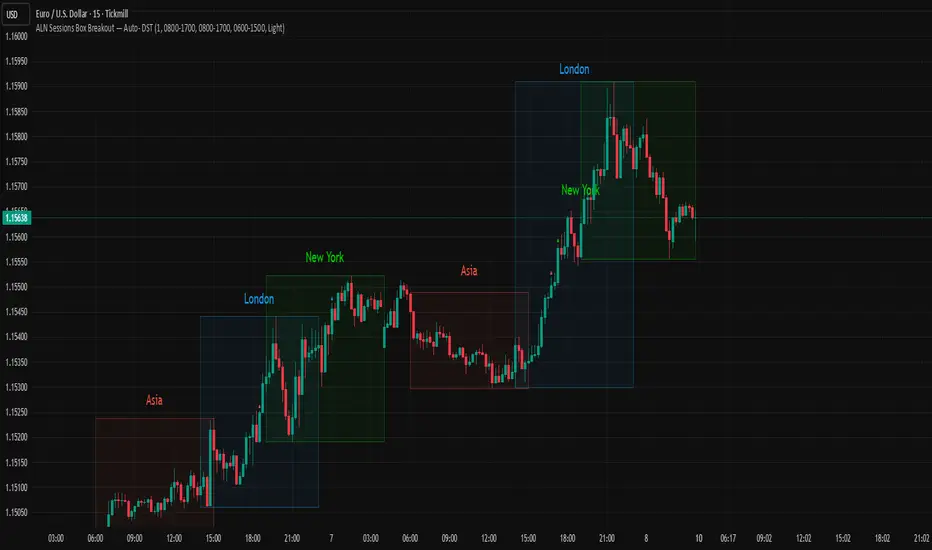
ALN Sessions Box — Auto- DSTDevoleper: Sheikh Rakib
What it does
Draws candle-synced high/low range boxes for the three major sessions—Asia (Dhaka view), London, and New York—on any timeframe. London and New York are DST-aware (times auto-shift on DST changes). Boxes update live with session high/low and close exactly on the session’s final bar.
Key features
Auto-DST: Uses Europe/London and America/New_York time zones, so session windows auto-adjust when DST turns on/off.
Asia (BDT) window: Default 06:00–15:00 Asia/Dhaka (no DST).
Candle-linked boxes: Top/bottom track session High/Low; right edge finalizes on the session end bar—clean breakout zones.
Clean UI: Optional labels, outline toggle, and three opacity presets (Dark/Medium/Light).
Plug & play: Drop in, customize colors/times, done.
Inputs you can tweak
Time Range (LOCAL) for each session
Defaults: Asia 06:00–15:00 (Asia/Dhaka), London 08:00–17:00 (Europe/London), New York 08:00–17:00 (America/New_York)
For equities, switch New York to 09:30–16:00—DST handling remains automatic.
Colour per session, Show Session Labels, Show Range Outline, Opacity Preset.
UTC Offset input is retained for compatibility but not used for session detection.
Quick BDT reference (for the default 08:00–17:00 local windows)
London → DST ON (BST): 13:00–22:00 BDT · DST OFF (GMT): 14:00–23:00 BDT
New York → DST ON (EDT): 18:00–03:00 BDT (next day) · DST OFF (EST): 19:00–04:00 BDT (next day)
Asia (Dhaka) → 06:00–15:00 BDT (no DST)
Tips
If you see dotted vertical lines, that’s TradingView Session breaks (Chart Settings → Appearance). Turn off if you prefer a cleaner view.
Some symbols don’t trade during parts of a session—adjust Time Range as needed.
Labels are placed inside the box; adjust opacity/colors to suit your theme.
A sharp, professional session map for spotting breakouts, reversals, and volatility windows at a glance.
📋 Trading Checklist – Precision Entry SystemTake your trading discipline to the next level with this Precision Trading Checklist for TradingView. Designed for intraday traders following liquidity, structure, and Smart Money Concepts (SMC) AKA ICT Concepts, this overlay ensures you never miss a key confirmation before entering a trade.
Features:
✅ Pre-Market Preparation: Track previous session highs/lows, AM/PM sessions, and key liquidity zones.
✅ Bias & Narrative Check: Quickly confirm daily trend, price position relative to daily open, and higher timeframe confluence.
✅ Session-Specific Rules: Focused sessions like Silver Bullet (10:00–11:30), Afternoon (13:30–15:00), and Final Hour (15:00–16:00).
✅ Structure & Setup Validation: Confirm liquidity sweeps, market structure shifts, expansion candles, fair value gaps, and order blocks.
✅ Risk Management Reminders: Stop-loss, target points, risk percentage, breakeven management, and pyramiding rules.
✅ Post-Trade Journaling: Document entries, session, setup type, trade outcome, and grading for continuous improvement.
✅ Golden Rules: Visual reminders to enforce discipline, avoid emotional trades, and respect session limits.
Why Use It:
This checklist is perfect for traders who want to stay consistent, minimise mistakes, and follow a disciplined routine. Displayed as an overlay on your chart, it provides all essential checks in one glance, keeping you focused on the setup rather than scrolling through notes or separate trackers.
How to use:
Add the indicator to your chart
Click the settings/gear icon
Check off items as you complete them
The checklist on your chart updates in real-time with green checkmarks!
The checkboxes will persist as long as the indicator is on your chart,
making it perfect for tracking your pre-trade and post-trade routines!
Follow the checklist items step by step before entering trades.
Use the session-specific guidelines to filter setups.
Journal your trades post-execution for growth and analysis.

Willy ORB for Gold – Session Presets (NY 5m)What it does:
Plots the opening-range high/low for the main Gold sessions (Shanghai, Tokyo, Sydney, Frankfurt, London, New York 5-minute OR by default). It projects TP1/TP2 expansion targets, supports a timezone offset so opens line up with your broker, and includes breakout alerts on confirmed closes.
⸻
Why it’s Gold-friendly
• New York (COMEX pit): 5-minute opening range at ~20:20 local (via your offset) to capture the most active burst.
• London / Frankfurt: strong European volatility windows for XAU/USD.
• Shanghai / Tokyo / Sydney: structure-setting sessions before momentum builds.
⸻
Features
• Session presets: SH, TK, SY, FR, LDN, NY (5m) — toggle individually
• 15m OR for all sessions except NY (5m) by default (editable per session)
• TP1 / TP2 expansion targets (user-defined multiples)
• Labels for 15m/5m range and targets; customizable styles
• Timezone offset control (aligns lines to your local clock)
• Daily auto-reset for clean levels
• Alerts: “Closed Above Range High” / “Closed Below Range Low” per session
⸻
How to use
1. Add to chart (best on 1–15m).
2. In settings → Gold Sessions, toggle the sessions you want.
3. Set “My time offset from chart (hours)” so session lines match your broker time.
4. Trade the breakouts: when price closes beyond the session high/low, TP levels plot automatically.
⸻
Parameters (quick guide)
• Targets: TP1/TP2 multiples (e.g., 1.0 and 2.0).
• Labels: left/right label placement, line styles/colors.
• Sessions: enable/disable + choose each session’s OR length (NY defaults to 5m).
⸻
Tips for XAU/USD
• London often gives the cleanest first breakout.
• New York tends to drive continuation after data releases.
• Consider pairing with volume/volatility or HTF trend for confluence.
⸻
Notes
• Built in Pine Script v6.
• Indicator (not a strategy). For backtests, use a companion strategy that trades the closes beyond the OR with SL at the opposite side and TP by R.
⸻
Disclaimer
For educational purposes only. Not financial advice. Always backtest and manage risk.

GMS Session Rays – (Sydney/Asia/London/NY)GMS Session Rays – (Sydney/Asia/London/NY)
A lightweight Pine v6 indicator that plots the previous completed session’s High and Low for the four major sessions—Sydney, Asia, London, New York—so you always see the most actionable structure levels without chart clutter. Lines auto update at the end of each session and extend right as horizontal rays. Labels are clean, stack automatically to avoid overlap, and can be placed on the left or right side of the chart.
What it shows
Previous session High/Low for each enabled session (not the current live session).
Right extended rays at those prices, updated when the session closes.
Optional labels per session (e.g., “Sydney high”, “London low”), with auto stacking to prevent overlaps.
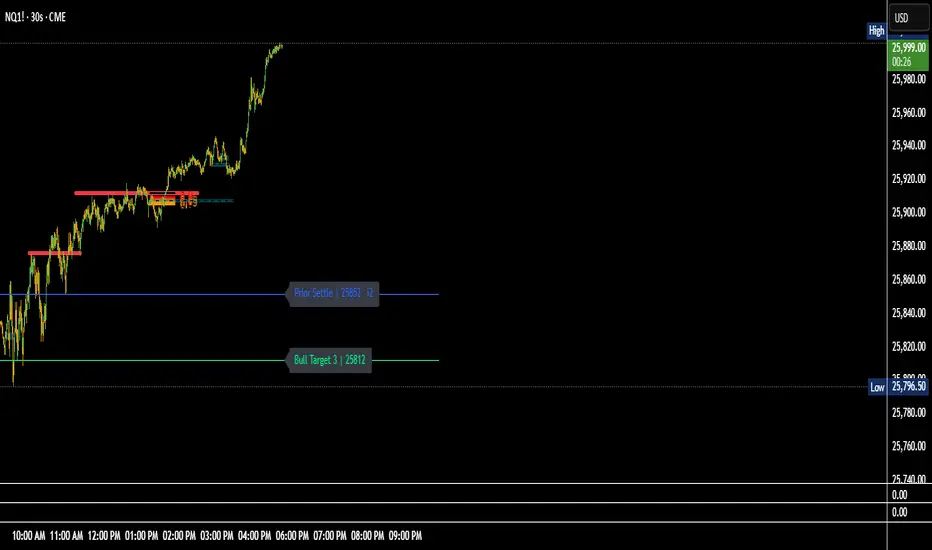
NQ Key Levels MapThe NQ Key Levels Map is a fully customizable tool designed to visually mark your most important trading levels on the Nasdaq futures (NQ) chart. It provides quick at-a-glance reference points for both bullish and bearish scenarios, as well as key overnight and contextual levels — all color-coded, labeled, and positioned exactly how you prefer.
This indicator helps traders maintain spatial awareness of critical price zones throughout the session without cluttering the chart.
💡 Key Features:
🟩 Bullish Levels (Green)
Max ATM – highest key level or equilibrium pivot.
Bull Trigger – upside breakout or entry confirmation.
Bull Targets 1–3 – progressive profit targets for bullish continuation.
🟥 Bearish Levels (Red)
Min ATM – lowest key level or equilibrium pivot.
Bear Trigger – downside breakout or short confirmation.
Bear Targets 1–3 – progressive downside objectives.
Overnight Low – prior session low reference.
🟦 Contextual Levels (Blue)
Overnight High – prior session high reference.
Flip Area – inflection zone where sentiment can shift.
Prior Settle – yesterday’s settlement price anchor.
ICT SMART MONEY__Advanced Multi-Timeframe Target TREND indicator with comprehensive ICT (Inner Circle Trader) concepts, session analysis, and smart money concepts for professional forex and crypto trading.__
---
### __🔥 Core Features:__
#### __📈 Multi-Timeframe Analysis__
- __7 Timeframe Table__: 1min, 5min, 15min, 30min, 1hour, 4hour, Daily analysis
- __Target System__: Stop Loss, Entry, TP1, TP2, TP3 calculations for each timeframe
- __Trend Direction__: Visual arrows showing bullish/bearish bias across all timeframes
#### __⚡ ICT Killzone Sessions__
- __4 Major Sessions__: Asia KZ, London KZ, NY AM, NY PM with colored session boxes
- __Pivot Lines__: Automatic high/low detection with full format labels ("ASIA High", "LONDON Low")
- __Global Label Alignment__: All session labels perfectly aligned for professional appearance
- __Range Analytics__: Real-time pip calculations with historical averages and Turkish volatility analysis
#### __🌍 Trading Session Management__
- __Individual Controls__: Asia/London sessions auto-enabled, NY sessions optional
- __Horizontal Lines__: Clean session high/low tracking without clutter
- __NY Lunch Session__: Additional 11:30-13:30 session for advanced analysis
- __Session Transparency__: Adjustable transparency levels for optimal chart visibility
#### __📍 Professional Key Levels__
- __Monday High/Low__: Weekly opening reference levels
- __Previous Day High/Low__: Daily support/resistance zones
- __Previous Week High/Low__: Major weekly levels
- __Full Format Labels__: "Previous Day High" instead of "PDH" for crystal clarity
- __160 Bar Distance__: Optimized label positioning for clean charts
#### __🔗 Liquidity Trendlines__
- __Automatic Detection__: 8-bar lookback pivot detection system
- __Breakout Signals__: Visual alerts when trendlines are broken
- __Dynamic Padding__: 4.0 ATR-based trendline spacing
- __Bullish/Bearish Colors__: Clear color coding for trend direction
#### __💎 Smart Money Concepts (SMC)__
- __Fair Value Gaps (FVG)__: Automatic gap detection with mitigation tracking
- __Structure Analysis__: BOS (Break of Structure) and CHoCH (Change of Character) detection
- __Structure Fibonacci__: 5-level fibonacci retracements (78.6%, 70.5%, 61.8%, 50%, 38.2%)
- __Lifecycle Management__: Complete FVG and structure history tracking
#### __📊 Range Analytics Table__
- __Session Volatility__: Current pip movement vs historical averages
- __Turkish Analysis__: "Güçlü Momentum", "Yüksek Aktivite", "Normal Aktivite", "Düşük Hareket", "Zayıf Session"
- __Integrated Display__: Seamlessly positioned below multi-timeframe table
- __Professional Formatting__: Color-coded session identification with status analysis

Simple CPR for intraday index tradingSimple CPR is an indicator that displays the Central Pivot Range (CPR) and Support-Resistance pivots. It offers granular customization across CPR, Floor pivots, Developing CPR, and Session High/Low levels.
Original concept from Larry Williams, Mark Fisher & Frank Ochoa
Modified from " CPR (Central Pivot Range)" script by ajithcpas
What is CPR (Central Pivot Range)?
The Central Pivot Range (CPR) is calculated from the previous period’s High (H), Low (L), and Close (C). It forms three levels:
• Pivot (P) = (H + L + C) / 3
• Top Central (TC) = ( P - BC) + P
• Bottom Central (BC) = ( H + L)/2
Together, these levels form a central zone representing the market’s “value area.” Price trading above the CPR typically indicates bullish sentiment, while trading below the CPR reflects bearish bias. A narrow CPR often precedes strong trending moves, whereas a wider CPR signals potential consolidation.
How Pivot Levels are Calculated
Beyond CPR, the indicator supports multiple pivot calculation models, including Traditional, Classic, Fibonacci, and Camarilla
For example, in the traditional model:
• R1 = ( 2 × P ) − L
• S1 = ( 2 × P ) − H
• Higher levels (R2, R3…) scale proportionally by the prior range (H-L).
These levels serve as dynamic intraday support-resistance zones and breakout targets.
Key Features
⦿ Multi-Formula CPR : Select Traditional, Classic, Fibonacci, or Camarilla pivots.
⦿ Multi-Timeframe Control : Auto-detect or manually set CPR timeframe (Daily → Yearly).
⦿ Complete Pivot Suite : Extending to five resistance and five support levels (R1–R5, S1–S5) with optional midpoints (R0.5, R1.5, R2.5, R3.5, R4.5, S0.5, S1.5, S2.5, S3.5, S4.5).All levels can be individually toggled on or off, giving traders complete control over the level of chart detail they prefer.
⦿ Full Customization : Independently toggle lines, fills, price labels, and level names.
⦿ Developing CPR & S/R : Real-time projection of next-session CPR, R1, and S1 with separate visibility controls.
⦿ Session High/Low Tracking : Plot Previous-Session High (PH) & Low (PL) with optional labels and prices.
⦿ Look-Back Flexibility : Display any number of historical CPR/pivot periods.
⦿ Styling Precision : Choose line width, style (solid, dashed, dotted), and individual colors.
⦿ Optional Fills : Visualize the CPR zone or CPR–R1/S1 bands with semi-transparent shading.
⦿ Optimized Performance : Efficient array-based drawing for smooth chart performance even with a long history.
Use Case
CPR analysis helps identify trend bias, volatility contraction/expansion, and key support-resistance zones. This indicator is ideal for intraday indices traders who need a structured yet customizable price-action framework.
Disclaimer
This script is for educational and technical analysis purposes only. It does not constitute financial advice or a recommendation. Always perform independent analysis and manage risk appropriately before placing trades.

Session VWAP & ATR H/L ZonesThis script is a comprehensive tool for day traders, designed to visualize key price levels and zones based on volume and volatility within a specific trading session.
Traders would use your script to identify potential areas of support and resistance, gauge the session's trend, and spot opportunities for mean reversion or breakout trades.
Core Concepts Explained
Your script plots three main types of information on the chart, each serving a different purpose for a trader.
1. Session VWAP (Volume-Weighted Average Price) 📈
What it is: The yellow line is the VWAP, which is the average price of an asset for the current trading session, weighted by the volume traded at each price level. It essentially shows the "fair" price for the day according to the market's activity.
How it's used:
Trend Gauge: If the price is consistently trading above the VWAP, it's generally considered a bullish intraday trend. If it's below, the trend is bearish.
Dynamic Support/Resistance: During a trend, traders often look for the price to pull back to the VWAP to find an entry point (e.g., buying a dip to the VWAP in an uptrend).
VWAP Bands: The optional gray, red, and green bands are standard deviations from the VWAP. They measure how far the price has strayed from its "fair value."
2. ATR High/Low Zones (Support & Resistance) 🎯
What they are: These are the shaded green and red areas at the top and bottom of the session's price range.
The red zone (resistance) is calculated by taking the session's current high and subtracting a value based on the Average True Range (ATR), which is a measure of recent volatility.
The green zone (support) is calculated by taking the session's current low and adding the ATR-based value.
How they're used: These are not just lines; they are zones of interest.
Profit-Taking Areas: A trader who is long might consider taking profits when the price enters the red resistance zone.
Reversal Signals: When the price enters one of these zones and shows signs of stalling (e.g., with specific candlestick patterns), it could signal a potential reversal.
3. Previous Session High & Low 📊
What they are: The script plots the high and low from the previous trading session as straight horizontal lines (teal and fuchsia by default).
How they're used: These are extremely significant static levels that many traders watch.
Price Magnets: Price is often drawn to these levels.
Key Inflection Points: A decisive break above the previous day's high can signal strong bullish momentum. Conversely, a failure to break it can indicate weakness. These levels frequently act as strong support or resistance.

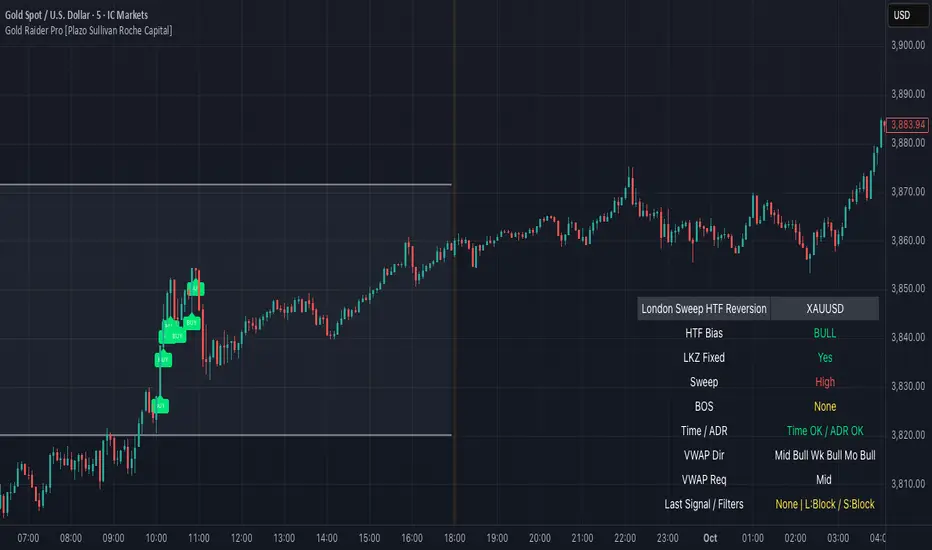
Gold Raider Pro [Plazo Sullivan Roche Capital]Core logic
During the London kill-zone, the script locks in the session high/low (LKZ).
After London ends, it looks for a liquidity sweep (price pokes beyond LKZ high/low) then a BOS (break of the first opposing swing) to confirm reversal.
Trades are only valid with higher-timeframe bias (D1 & H4 above/below EMA-50 in agreement).
Optional filters block weak signals: time gate (NY cutoff), ADR (skip if the day’s move is already stretched), and VWAP alignment (Midnight/Weekly/Monthly).
Output is a unified signal: BUY after low sweep + BOS in bull HTF, SELL after high sweep + BOS in bear HTF; labels + dashboard summarize state and reasons.
Best setup & usage
Chart & broker: XAUUSD on a high-liquidity feed (ICMarkets/FXPro/OANDA). Use 2m–5m for executions; confirm with 15m market structure.
Session: Set timezone to America/New_York. Default London kill-zone 02:30–04:30 NY; stop taking new signals after 11:00 NY (toggle in inputs).
HTF bias: Keep EMA length = 50 on D & H4 (default). Only toggle off bias if you’re deliberately testing counter-trend sweeps (not recommended live).
Structure/BOS: Use Swing Length = 3. Leave “Require BOS after the sweep” = ON for the cleanest signals; turn “Require close back inside LKZ” ON only if you want ultra-conservative entries.
VWAP filters: Keep Midnight VWAP = ON; add Weekly/Monthly only on trend days to avoid over-filtering range sessions.
ADR guardrail: Enable ADR filter once you go live; start with ADR Threshold = 0.9 and Lookback 14. This blocks chasing extended moves.
Execution playbook:
BUY: Wait for low sweep of LKZ → BOS up → dashboard shows BULL bias, Time/ADR OK, VWAP pass. Enter on the next pullback or at close; SL below BOS invalidation (or fixed 0.5–0.8× ADR14 of XAU).
SELL: Mirror logic after a high sweep in BEAR bias; SL above BOS invalidation.
TP: Scale at 1R, leave runner to 2–3R or to Midnight/Weekly VWAP touch; hard exit by NY lunchtime or on bias flip.
Risk: 0.25–0.5% per trade (XAU is spiky). One trade per direction per session; if ADR block triggers post-entry, manage to BE or flatten if structure weakens.
Alerts & dashboard: Turn on runtime alerts once parameters are set. Read the Last Signal / Filters row; only act when it shows your direction and “L:OK / S:OK” for your side.
Validation & tuning: Forward-test 3–4 weeks. If over-filtered, relax VWAP Weekly/Monthly first; if too chatty, enforce close-back-inside and keep NY cutoff tight.
Don’ts: Don’t trade during major news spikes, don’t counter the D1/H4 agreement, and don’t enter before BOS—sweeps without structure confirmation are bait.
Session Breakout Detector (SBD)Overview:
The Session Breakout Detector (SBD) is a TradingView indicator designed to identify and visualize breakouts from major trading sessions. It tracks a selected session (Tokyo, London, or New York) and detects price movements beyond the session's high or low, assisting traders in spotting potential breakout opportunities.
Key Features:
- Session Selection: Choose between Tokyo, London, or New York sessions.
- Breakout Detection Modes:
- Confirmed Bar: Detects breakouts when a candle closes beyond the session's range.
- Intrabar: Detects breakouts as soon as the price exceeds the session's high or low within a
candle.
- Visual Indicators:
- Displays session high, low, and range with a colored box for clear visualization.
- Marks breakouts with green (bullish) or red (bearish) triangles.
- Optional 50-Period SMA: Adds a 50-period Simple Moving Average to the chart for trend
analysis.
- Alerts: Configurable alerts for bullish and bearish breakouts.
Usage Instructions:
1. Select Session: Choose the desired trading session (Tokyo, London, or New York) from the
input settings.
2. Choose Breakout Detection Mode: Select between 'By confirmed bar' or 'By intrabars' based
on your trading preference.
3. Enable SMA (Optional): Toggle the 'Use SMA?' option to display the 50-period Simple Moving
Average.
4. Set Alerts: Configure alerts for breakout signals as per your trading strategy.
⚠️Note: This indicator is intended for informational purposes only and should not be construed as financial advice. Users are encouraged to conduct their own research and consider their individual risk tolerance before making trading decisions.

Futures Day Trading Key Levels by Dhawal Ranka
Hey everyone, thank you for using this script, let me know in the comments how you feel about it!
What this script does:
This indicator renders one consolidated map of intraday reference levels for futures (e.g., ES, NQ, GC, CL). It is session-aware and draws:
- Previous ETH day High/Low/Close
- Previous RTH High/Low/Close (built from your RTH session)
- Today’s developing RTH High/Low and Mid
- Overnight (ON) session High/Low
- Opening Range (first N minutes of RTH): OR High/Low
- VWAP (day-anchored) with optional ±σ bands
- Floor Pivots (PP/R1/S1/R2/S2) from prior ETH daily bar
- ADR projections (Up/Down) using a configurable lookback and anchor
- Settlement: prior official settlement and today’s projected settle (with manual override)
- Weekly/Monthly context: prior W/M High/Low/Close and current W/M Open
- Minimal right-edge text tags (instead of big boxes) that sit on the price scale line and auto-pack when levels coincide
All lines extend across the chart to make confluence obvious without clutter.
How it works (methods & calculations)
Sessions
The script exposes two user sessions and a time zone:
RTH (e.g., 09:30–16:00 America/New_York)
ON (e.g., 18:00–09:29 America/New_York)
Session membership is computed with time(timeframe, session, tz) != 0.
RTH H/L/C (prev) are aggregated intrabar: on RTH start we seed H/L; while inRTH we update; on RTH end we store the close.
Previous Day (ETH) levels
request.security(syminfo.tickerid, "D", high /low /close ) supplies PDH/PDL/PDC on the continuous ETH daily.
Opening Range
On RTH start we mark orStartTime.
While RTH is active and elapsed time < N minutes, we track the running high/low.
When elapsed ≥ N minutes, we freeze OR High/Low.
VWAP & ±σ bands (intraday)
Day-anchored VWAP uses ta.vwap(hlc3).
Bands: standard deviation of (close − vwap) from day start, accumulated inline:
stdev = sqrt( mean(dev^2) − mean(dev)^2 )
Bands = vwap ± k * stdev (user multiplier).
Floor Pivots (classic)
Using prior ETH daily H/L/C:
PP = (H + L + C) / 3
R1 = 2*PP − L, S1 = 2*PP − H
R2 = PP + (H − L), S2 = PP − (H − L).
ADR projections
Daily range series rng = request.security(..., "D", high - low).
ADR = SMA(rng, L) (default L=14).
Anchor is user-selectable: today’s open or yesterday’s close.
Projections: ADR Up = anchor + ADR/2, ADR Down = anchor − ADR/2.
Settlement
Prev Settle defaults to prior ETH daily close but can be overridden manually for markets where official settlement differs from feed close.
Today Projected Settle uses the current ETH daily close value.
Weekly / Monthly context
Prior W/M H/L/C from "W"/"M" with , plus current W/M Open.
Rendering & label logic (originality)
Lines are persistent: each named level owns one line object that is updated, not re-created—keeps resource use low and avoids “too many plots”.
Right-edge labels are text-only (no box) placed at x = bar_index + offset and yloc.price.
When multiple levels share (almost) the same price, labels are packed side-by-side using a small bucketing algorithm:
Prices are bucketed within ±½ tick.
Each label gets a position index inside its bucket; the final x-offset = baseOffset + index*step + priority.
Priorities nudge important tags (e.g., Settle/RTH levels) closer to the price scale so they remain readable.
Why this is published & what’s original
It’s not a simple mashup: the script’s utility is the session-aware aggregation, the OR timing logic, the intraday σ calculation around VWAP, the line-persistence manager, and the label packing with priorities that keeps the right edge readable even when many levels coincide.
The closed-source protection covers the packing/priority scheme and the persistent object management that make it practical on busy futures charts without hitting Pine limits.
How to use
Set your sessions & time zone
Choose RTH/ON session windows (the defaults match CME equity index futures) and the time zone of your charting workflow.
Toggle components
Enable only the layers you need (e.g., VWAP bands off if you want a cleaner chart).
Opening Range length (minutes) is adjustable.
Settlement
If your broker/feed’s daily close isn’t the official settlement, enter a manual settle value for the prior day.
Read the right edge
Labels sit on the price scale line. When two labels share the same price, they appear side-by-side rather than overlapping.
Timeframes & symbols
Designed for intraday futures on 1–30m. Works on other symbols/timeframes but intent is day trading.
Inputs (summary)
Sessions/TZ: RTH window, ON window, time zone
Today: RTH H/L/Mid, ON H/L, OR (minutes)
VWAP: on/off, ±σ bands, multiplier
Pivots: PP/R1/S1/R2/S2 (ETH)
ADR: lookback, anchor (open vs. prev close)
Settlement: show prev/proj, manual override
Weekly/Monthly: prior H/L/C + current open
Style: line transparency; right-edge tag size, base offset, and step; optional inline labels
Limitations & notes
“Prev Settle” equals the prior daily close unless overridden.
Session definitions matter: if your exchange hours differ, set your own RTH/ON windows.
No alerts are included to minimize plot count and keep performance high (you can add alert conditions on any level in a private copy).
Disclaimer
For educational purposes only; not financial advice. Futures trading involves significant risk.
Versioning
This script will be maintained under a single publication using Update (no minor forks). Major changes will be documented in the Change Log section of the script description.

OPR 4 ZonesThe OPR 4-Zone Boxes indicator visualizes four distinct market sessions on your chart by automatically drawing boxed ranges (high / low) and dotted midlines for each session. Each session box is created using time-based timestamps (timezone-aware) and updates in real time during the session. When the session closes, the box is locked to the session end, while an optional extension can display the session range for a configurable period afterward — useful for spotting retests, breakouts, and bias zones.
Designed for traders who rely on session structure and price-action, OPR 4-Zone provides clear, non-intrusive visuals and is fully configurable: enable or disable individual sessions, set start/end and extension times per session, choose colors and transparency for both the primary box and the extension, and display dotted midlines to quickly gauge session control. Objects are cleaned up at the start of each new day to prevent clutter and ensure reliable behavior when scrolling or changing timeframes.
Key features :
- Four independent session boxes (Morning, Afternoon, Evening, Night) with separate enable switches
- Timezone-aware timestamping so boxes align with the session times you want
- Locked session ranges at session close and optional extension period after close
- Dotted midline for quick reference to the session midpoint
- Customizable colors and background transparency for both base and extended boxes
- Automatic cleanup of session objects on new trading day to avoid frozen or stray boxes
- Lightweight and overlay-friendly with sensible defaults for fast setup
Suggested usage :
Use the indicator to mark session ranges for intraday support/resistance, identify where price is trading relative to session midpoint, and watch for breakout or rejection setups near session highs/lows. Combine with volume-based or momentum indicators to confirm breakouts through the session box.
